
Poverty in India: Understanding Causes, Trends and Solutions
From Current Affairs Notes for UPSC » Editorials & In-depths » This topic
In April 2025, the Government of India highlighted that 171 million Indians were lifted out of extreme poverty in the previous decade. A World Bank update later noted that just 5.75% of Indians live below its revised poverty line (around $\text{3/day PPP), down from 27\% in 2011-12. This flurry of news has focused attention on India’s poverty trends. This article explores what poverty in India is, why it persists, where it remains high, when significant changes have occurred, who is most affected, and how it can be addressed, along with its significance, challenges and way forward.

What is poverty in India and how is it measured?
- Definition: Poverty is the inability to meet basic needs (food, clothing, shelter). In India it is measured both by low income/consumption and by non-monetary deprivation. The Multidimensional Poverty Index (MPI) captures education, health and living standards. India’s MPI fell from ~54\% in 2005-06 to ~16\% by 2019-21, reflecting big gains in schooling, sanitation and nutrition.
- Poverty Lines: India uses a national poverty line (based on consumption surveys – ~21.9\% of people were below it in 2011-12) and World Bank lines: }$2.15/day (extreme poverty) and $\text{3.65/day. By these measures, extreme poverty fell from ~16.2\% (2011-12) to ~2.3\% (2022-23), and }$\text{3.65/day poverty fell from ~61.8\% to ~28.1\% in the same period.
- Magnitude: In 2011-12 about 270 million Indians (22\%) were below the national poverty line. By 2022-23 that was largely eradicated under the }$2.15 line. Under the older $3/day line the poor fell from ~344 million in 2011-12 to ~75 million (5.75%) in 2022-23 – roughly 171 million people lifted out of poverty.

Why does poverty persist in India despite growth?
- Economic Structure: Over half of Indians work in agriculture (only ~15% of GDP), so small farmers and landless laborers earn very little. Dependence on the monsoon (rain-fed farming) means droughts or floods can push families back into poverty. Many poor work in the informal sector (daily-wage construction or vending) with no steady income or benefits.
- Education and Skills: Poor families often lack education or vocational training. High school dropout rates and low-quality schools in villages mean few opportunities for higher-paying jobs. Unskilled youth and adults can only find low-paid work, making it hard to rise above the poverty line.
- Inequality and Exclusion: Social factors keep some communities poorer. Scheduled Castes (SC) and Scheduled Tribes (ST) have poverty rates ~1.5–2 times the national average. Discrimination and tradition also limit women’s income-earning roles. Minority groups (e.g. some religious or ethnic groups) often have higher poverty due to fewer opportunities.
- Infrastructure and Governance: Many poor areas lack basic services. For example, villages with no roads, electricity or irrigation see stagnating incomes. Poor public health and sanitation mean medical costs can ruin family budgets. Delays, leakages or poor implementation in welfare programs also leave some needy people without aid.

Where in India does poverty remain most severe?
- Rural Concentration: The bulk of India’s poor live in villages. States in central, eastern and northern India (e.g. Bihar, Uttar Pradesh, Madhya Pradesh, Odisha, Jharkhand) have the highest poverty rates. For instance, in 2011-12 Bihar’s poverty rate was ~58% and Madhya Pradesh’s ~49%, far above the national average.
- State Disparities: In contrast, some states like Kerala, Goa and Himachal Pradesh have poverty rates below 10%. These variations reflect differences in literacy, industry and social programs.
- Urban vs Rural: Urban poverty rates are much lower (around 14% nationally in 2011-12), but cities still have large slum populations. Megacities like Mumbai and Delhi have significant numbers of poor despite low percentages, while many small towns in rich states have negligible poverty.

When did India see significant changes in its poverty levels?
- Post-Independence: India’s poverty was very high at independence (~70%). The Green Revolution (1960s-70s) and land reforms began lowering it; poverty fell to roughly 45% by 1983.
- Economic Reforms: Growth and welfare in the 1990s-2000s reduced poverty further. By 2004-05 it was ~27.5%, and by 2011-12 about 21.9% (Tendulkar line). The 2006 launch of MGNREGA (rural jobs guarantee) provided income support that helped rural poor.
- Recent Decade: According to the World Bank, poverty has plunged in the 2010s. Extreme poverty ($\text{2.15/day PPP) dropped from 16.2\% in 2011-12 to ~2.3\% in 2022-23. Even under a higher }$3.00/day line it fell from 27% to 5.75%. The COVID-19 crisis in 2020 caused a temporary spike, but relief measures (cash transfers, food aid) and recovery helped resume the decline.

Who are most affected by poverty in India?
- Rural Households: The majority of India’s poor live in villages. Landless labourers and smallholder farmers (with tiny plots) make up a large share. Rural poor families often have high child malnutrition and illiteracy rates.
- Marginalised Communities: Poverty is higher among SC/ST communities (often double the national rate). For example, in 2011-12 about 47% of rural STs were below the poverty line. Women also face higher poverty due to wage gaps and lack of property rights.
- Informal and Migrant Workers: Many poor people work as casual laborers (construction, agriculture, street vending). Migrant laborers in cities often sleep in slums or temporary shelters, making them vulnerable to income shocks and lacking social security.
- Children and Elderly: A large share of the poor are children (from families with limited nutrition). Poor elderly (without pensions) rely on family support to survive.

How is poverty being measured and addressed in India?
- Measurement: Poverty is tracked using household consumption surveys. India’s national poverty line was based on minimum calorie consumption. Internationally, the World Bank’s benchmarks ($2.15/day, $3.65/day PPP) allow comparisons. India also uses a Multidimensional Poverty Index (MPI) capturing health, education and assets. These measures together give a fuller picture of deprivation.
- Government Measures: India has many programs targeting the poor:
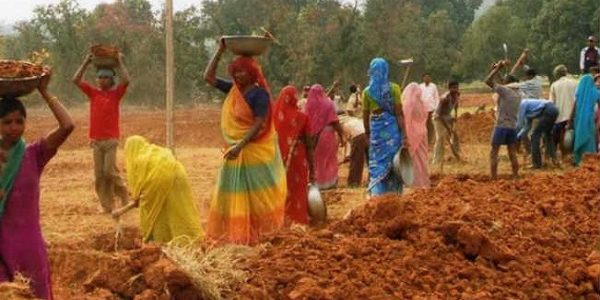
- MGNREGA (Jobs): Guarantees up to 100 days of rural work per household, providing wage income in villages.
- Public Distribution (Food): The subsidized food grain scheme covers about 800 million people, ensuring basic nutrition.
- Jan Dhan Yojana: Over 450 million poor have bank accounts for direct transfers of subsidies and wages.
- Health and Housing:Ayushman Bharat (health insurance for ~500 million) and housing schemes (PMAY-Gramin/Urban) improve living conditions.
- Agriculture Support: Minimum Support Prices and crop insurance aim to raise farm incomes.
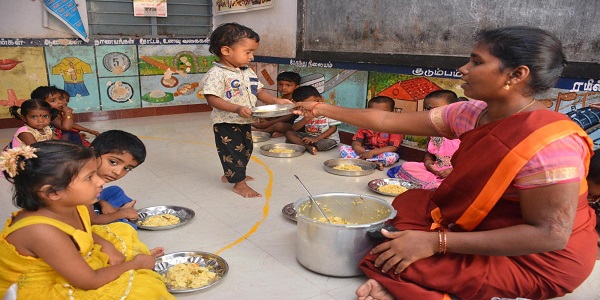
- Education and Training: Scholarships, mid-day meals, and skill programs (Skill India, NRLM) help poor students and workers.

What is the significance of addressing poverty in India’s development?
- Inclusive Growth: Lifting people out of poverty expands domestic demand and the workforce. As incomes rise, new consumers and entrepreneurs further drive GDP growth.
- Human Development: Poverty reduction improves health, education and nutrition outcomes. For example, fewer undernourished children and higher school attendance result from higher family incomes.
- Social Justice and Stability: Reducing extreme deprivation promotes social cohesion. It is also an ethical imperative to ensure disadvantaged groups (SC/ST, women) share in India’s progress.
- Sustainable Goals: Eradicating poverty is central to India’s commitments under the UN Sustainable Development Goals. Success here also helps achieve related goals (zero hunger, good health). It boosts India’s global standing as a leader in development.
- Economic Resilience: A larger middle class and reduced inequality mean the economy can better withstand shocks, making recovery from crises easier.

What are the limitations and challenges in India’s poverty alleviation efforts?
- Data and Targeting: India has not updated its official poverty estimates since 2011-12, making it hard to track current trends. Without recent data, some pockets of poverty may be missed. Errors in targeting mean some needy families (e.g. without proper ID) still miss benefits.
- Growth vs Inclusion: Economic growth has not always reached the poor. Many jobs created are informal or low-paying. Rising inequality in the past meant income gains were unevenly shared, so the rich benefited more.
- Social Barriers: Caste, tribe and gender biases limit opportunities. Women still earn much less and own little property, constraining household incomes. Marginalized communities often face discrimination and poorer access to education and health.
- Implementation and Governance: Leakages, delays or corruption can dilute welfare measures. For example, some entitled people lack ration cards or bank accounts, reducing scheme coverage. Weak local governance sometimes fails to deliver basic services (water, electricity, toilets) to all.
- External Shocks: Climate change (droughts, floods) and crises (like pandemics or food-price inflation) can quickly push vulnerable families back into poverty. Maintaining gains requires constant vigilance and quick relief mechanisms.

What are the ways forward to further reduce poverty in India?
- Accelerate Inclusive Growth: Promote job-intensive growth. Improve agriculture (irrigation, credit, technology) so farmers earn more. Encourage manufacturing and services to create stable jobs. Support small rural enterprises and self-employment to raise incomes.
- Invest in Human Capital: Strengthen education and health in poor areas. Ensure quality schools, vocational training and clinics are accessible to all. Expand nutrition programs and digital literacy so poor families have better opportunities.
- Empower Vulnerable Groups: Focus on women and marginalized communities. Provide property and inheritance rights to women. Ensure SC/ST communities get scholarships, land rights and skill training. Proactively include minorities in development programs.
- Efficient Welfare and Infrastructure: Use technology (Aadhaar, digital payments) to deliver subsidies directly, reducing leakages. Expand rural infrastructure (roads, power, internet) to link poor areas to markets. Improve sanitation and housing (Swachh Bharat, PMAY) for healthier living.
- Build Resilience: Promote climate-resilient farming (drought-resistant seeds, rainwater harvesting) and expand crop insurance for small farmers. Prepare safety nets (rainy-day funds, employment schemes) to protect poor households from unexpected shocks.

What do comparative statistics reveal about poverty trends in India?
- The table below compares poverty headcount ratios under two international poverty lines in 2011-12 and 2022-23, showing sharp declines: Poverty Line (US$\text{ per day, PPP)Poverty Rate in 2011-12 (\%)Poverty Rate in 2022-23 (\%)}$2.15 (Extreme poverty)16.2%2.3%$\text{3.65 (Lower-middle-income poverty)61.8\%28.1\%
- Interpretation: The data show India’s poverty headcount fell dramatically. Extreme poverty is now almost gone, and even the broader }$3.65/day poverty category was cut by more than half. In effect, about 171 million people moved above these poverty thresholds in a decade.
- Global context: By 2022-23 India’s ~2.3% extreme poverty rate is lower than that of most South Asian neighbors, reflecting rapid development. However, nearly 1 in 4 Indians still subsist on under $3.65/day, so continued efforts are needed.

India’s poverty has declined dramatically, from over 20% in 2011-12 to about 2-3% today by global measures. These gains are among the largest poverty reductions in any large country. However, many millions remain just above the poverty line or are vulnerable to shocks, so the job is not done. Sustaining momentum requires inclusive growth (creating jobs and improving education/healthcare) and strong social safety nets. Focusing on the most marginalized communities is essential to eliminate the remaining pockets of poverty. Continued emphasis on equitable development will be key to achieving prosperity for all.
Q. What factors explain the reduction in poverty in India, and why do some regions or communities still lag behind? (250 words)

Related Posts
If you like this post, please share your feedback in the comments section below so that we will upload more posts like this.

Responses