
5.5.2 Human Development Indices (HDI) | Welfare and Growth Indicators
The Human Development Index, commonly abbreviated as HDI, represents a paradigmatic shift in the conceptualisation and measurement of national progress. Moving beyond the narrow confines of economic output, it offers a composite statistical measure that evaluates a country’s average achievement in three fundamental dimensions of human development: a long and healthy life, access to knowledge, and a decent standard of living. Developed by the United Nations Development Programme (UNDP), the HDI provides a more holistic framework for assessing welfare, challenging the long-held primacy of Gross Domestic Product (GDP) as the sole indicator of a nation’s well-being.
The Conceptual Underpinnings of Human Development
From Economic Growth to Human-Centric Development
- The evolution of development economics has been marked by a significant transition from a singular focus on economic growth metrics to a more encompassing view of human well-being.
- For much of the 20th century, the dominant paradigm equated development with economic growth, primarily measured by Gross National Product (GNP) or Gross Domestic Product (GDP) per capita.
- This approach assumed that the benefits of economic growth would automatically “trickle down” to all segments of society, leading to improved living standards.
- Policy prescriptions were heavily focused on industrialisation, capital accumulation, and market liberalisation to maximise economic output.
- By the 1970s and 1980s, the limitations of this growth-centric model became increasingly apparent.
- Many countries achieved high rates of GDP growth, yet witnessed rising inequality, persistent poverty, and negligible improvements in the quality of life for large sections of their populations.
- This disconnect prompted a re-evaluation of the meaning and measurement of development, giving rise to alternative approaches that placed human beings at the centre of the development process.
- For much of the 20th century, the dominant paradigm equated development with economic growth, primarily measured by Gross National Product (GNP) or Gross Domestic Product (GDP) per capita.
The Capability Approach: The Philosophical Bedrock
- The intellectual foundation for the Human Development Index is largely credited to the “Capability Approach,” pioneered by Nobel laureate Amartya Sen.
- This approach posits that development should be assessed not by a person’s income or the commodities they can purchase, but by their “capabilities” – the substantive freedoms they have to lead the kind of life they value.
- Sen distinguished between “functionings” and “capabilities.”
- Functionings are the various things a person may value doing or being. These can be elementary, such as being adequately nourished or being free from avoidable morbidity, or they can be more complex, such as having self-respect or participating in the life of the community.
- Capabilities represent the set of alternative combinations of functionings that are feasible for a person to achieve. It is the freedom to choose from these possible livings.
- For instance, two people might have the same low level of food intake (“functioning”), but their capabilities might differ. One person may be starving due to lack of access to food, while another may be fasting for religious reasons. The first person lacks the capability to be well-nourished, whereas the second person has the capability but chooses not to exercise it. The Capability Approach is concerned with the former.
- The HDI operationalises this philosophy by selecting a few key, universally valued capabilities.
- The capability to live a long and healthy life.
- The capability to be knowledgeable and educated.
- The capability to have access to resources needed for a decent standard of living.
- The HDI is thus a practical, albeit simplified, application of this rich philosophical framework, translating abstract concepts into a measurable index.
The Genesis of the Human Development Index
- The first Human Development Report, published by the UNDP in 1990, introduced the HDI as its centrepiece.
- Led by Pakistani economist Mahbub ul Haq, the team that created the HDI was explicitly motivated by the need to challenge the dominance of GDP per capita as the summary measure for a country’s development status.
- Haq famously stated, “The real wealth of a nation is its people. And the purpose of development is to create an enabling environment for people to enjoy long, healthy, and creative lives.”
- The index was designed to be simple and transparent, a composite of a few key indicators to facilitate its use in public discourse and policy-making.
- The initial formulation was a simple arithmetic mean of the three dimension indices. This was later revised in 2010 to a geometric mean to account for the imperfect substitutability between the dimensions.
- The HDI has since become one of the most influential and widely used indices of well-being, sparking a global debate on the true meaning of development and successfully broadening the discussion beyond the narrow confines of income.
The Three Fundamental Dimensions of HDI
A Long and Healthy Life
- This dimension is considered the most fundamental aspect of human development, as the ability to enjoy other opportunities is contingent upon being alive and healthy.
- Indicator: The HDI uses a single, powerful indicator to capture this dimension: life expectancy at birth.
- Life expectancy at birth indicates the number of years a newborn infant would live if prevailing patterns of age-specific mortality rates at the time of birth were to stay the same throughout the infant’s life.
- It is a summary measure of a nation’s overall health status, reflecting factors such as the quality of the healthcare system, public health policies, sanitation, nutrition, and prevalence of violence or conflict.
- A country with a high life expectancy, such as Japan with 84.5 years, generally has a well-developed healthcare infrastructure, low infant and child mortality rates, and effective management of both communicable and non-communicable diseases.
- Conversely, a country with a low life expectancy, like Chad with 52.5 years, faces significant challenges in these areas.
- Rationale for Selection:
- Universality: The desire for a long and healthy life is a universally shared human value.
- Data Availability: Life expectancy data is one of the most widely collected and reliable demographic statistics available for almost all countries.
- Outcome-Oriented: It measures an outcome (longevity) rather than an input (like the number of doctors or hospitals), which is more aligned with the capability approach.
- Indicator: The HDI uses a single, powerful indicator to capture this dimension: life expectancy at birth.
Access to Knowledge
- This dimension reflects the capability of individuals to participate in the learning process, acquire knowledge, and engage in the cultural and intellectual life of their society.
- Indicators: The HDI uses two indicators to create an Education Index for this dimension.
- Expected Years of Schooling (EYS):
- This is the number of years of schooling that a child of school entrance age can expect to receive if prevailing patterns of age-specific enrolment rates persist throughout the child’s life.
- It is a forward-looking indicator that captures the future potential for human capital formation. For instance, a high EYS value of over 18 years, as seen in countries like Australia, suggests a robust and accessible education system from primary through to tertiary levels.
- Mean Years of Schooling (MYS):
- This is the average number of years of education received by people aged 25 and older, converted from education attainment levels using official durations of each level.
- It is a stock indicator, reflecting the accumulated educational attainment of the adult population. A country like India has a mean years of schooling value of around 6.9 years, indicating historical gaps in educational access.
- Expected Years of Schooling (EYS):
- Combining the Indicators:
- The use of both EYS and MYS provides a more balanced picture of a country’s educational status.
- EYS points to the current commitment and future prospects, while MYS reflects the historical legacy. A country might have a high EYS due to recent policy changes but a low MYS because older generations had limited access to education.
- The two indicators are normalised and then averaged to form the single Education Index.
- Indicators: The HDI uses two indicators to create an Education Index for this dimension.
A Decent Standard of Living
- This dimension captures the capability of individuals to access the resources required to lead a dignified life and pursue their goals.
- Indicator: The HDI uses Gross National Income (GNI) per capita, adjusted for purchasing power parity (PPP).
- Gross National Income (GNI) is the total domestic and foreign output claimed by residents of a country, consisting of GDP plus factor incomes earned by foreign residents, minus income earned in the domestic economy by non-residents.
- Per Capita: The GNI is divided by the mid-year population to get a per capita figure.
- Purchasing Power Parity (PPP): The GNI per capita is expressed in constant international dollars using PPP rates. PPP adjusts for differences in the cost of living between countries, allowing for a more accurate comparison of real living standards. For example, $100 in a country like India would buy significantly more goods and services than $100 in a country like Switzerland. PPP conversion addresses this disparity. A GNI per capita (PPP) of $9,047 for a nation indicates its average income level after accounting for international price differences.
- Logarithmic Transformation:
- To reflect the principle of diminishing marginal utility of income, the HDI uses the natural logarithm of the GNI per capita figure.
- This means that an increase in income from $1,000 to $2,000 represents a much greater improvement in human development than an increase from $50,000 to $51,000.
- The logarithm ensures that as a country gets richer, further increases in income contribute progressively less to its HDI score, preventing the index from being dominated by the economic performance of high-income countries. This aligns with the core philosophy that income is a means to development, not an end in itself.
- Indicator: The HDI uses Gross National Income (GNI) per capita, adjusted for purchasing power parity (PPP).
The Calculation Methodology of the HDI
Step 1: Creating the Dimension Indices
- The calculation of the HDI begins with the normalisation of the four component indicators (one for health, two for education, one for income) into dimension indices. This process rescales the actual values into a unit-free index ranging from 0 to 1.
- The normalisation is done using a set of “goalposts” – minimum and maximum values for each indicator. These goalposts are established by the UNDP and represent the observed range of values globally over time. For the 2023/2024 report, the goalposts are:
- Life Expectancy at Birth: Minimum of 20 years, Maximum of 85 years.
- Expected Years of Schooling: Minimum of 0 years, Maximum of 18 years.
- Mean Years of Schooling: Minimum of 0 years, Maximum of 15 years.
- GNI per capita (2021 PPP $): Minimum of $100, Maximum of $75,000.
- The general formula for creating a dimension index is:
- [latex]DimensionIndex = \frac{(ActualValue – MinimumValue)}{(MaximumValue – MinimumValue)}[/latex]
Sub-Step 1.1: Calculating the Health (Life Expectancy) Index
- Using the formula above, the Health Index is calculated directly.
- [latex]I_{Health} = \frac{(LifeExpectancy – 20)}{(85 – 20)}[/latex]
- Numerical Problem: Suppose a country has a life expectancy of 72.0 years.
- Solution:
- [latex]I_{Health} = \frac{(72.0 – 20)}{(85 – 20)} = \frac{52.0}{65} \approx 0.800[/latex]
- Solution:
Sub-Step 1.2: Calculating the Education Index
- The Education Index is a composite of two sub-indices: the Mean Years of Schooling Index ([latex]I_{MYS}[/latex]) and the Expected Years of Schooling Index ([latex]I_{EYS}[/latex]).
- First, each schooling index is calculated using the normalisation formula:
- [latex]I_{EYS} = \frac{(Expected;Years;of;Schooling – 0)}{(18 – 0)}[/latex]
- [latex]I_{MYS} = \frac{(Mean;Years;of;Schooling – 0)}{(15 – 0)}[/latex]
- Next, these two indices are combined using an arithmetic mean to form the final Education Index ([latex]I_{Education}[/latex]).
- [latex]I_{Education} = \frac{(I_{EYS} + I_{MYS})}{2}[/latex]
- Numerical Problem: A country has an Expected Years of Schooling of 13.0 years and a Mean Years of Schooling of 6.9 years.
- Solution:
- Calculate [latex]I_{EYS}[/latex]: [latex]\frac{(13.0 – 0)}{(18 – 0)} \approx 0.722[/latex]
- Calculate [latex]I_{MYS}[/latex]: [latex]\frac{(6.9 – 0)}{(15 – 0)} = 0.460[/latex]
- Calculate [latex]I_{Education}[/latex]: [latex]\frac{(0.722 + 0.460)}{2} = \frac{1.182}{2} = 0.591[/latex]
- Solution:
Sub-Step 1.3: Calculating the Income Index
- The Income Index is calculated using the natural logarithm ([latex]ln[/latex]) of the GNI per capita to reflect diminishing returns.
- The formula is:
- [latex]I_{Income} = \frac{(ln(GNIpc) – ln(100))}{(ln(75000) – ln(100))}[/latex]
- Numerical Problem: The same country has a GNI per capita of $9,047 (2021 PPP $).
- Solution:
- [latex]ln(9047) \approx 9.110[/latex]
- [latex]ln(100) \approx 4.605[/latex]
- [latex]ln(75000) \approx 11.225[/latex]
- [latex]I_{Income} = \frac{(9.110 – 4.605)}{(11.225 – 4.605)} = \frac{4.505}{6.620} \approx 0.681[/latex]
- Solution:
Step 2: Aggregating the Indices to Compute the HDI
- Since 2010, the UNDP has used the geometric mean to aggregate the three dimension indices. This method is preferred over the arithmetic mean because it penalises unbalanced development.
- A low score in any one dimension is not fully compensated for by a high score in another. For a country to have a high HDI, it must perform well across all three dimensions.
- The formula for the HDI is:
- [latex]HDI = (I_{Health} \times I_{Education} \times I_{Income})^{1/3}[/latex]
- Final Calculation using the results from the numerical problems above:
- [latex]I_{Health} = 0.800[/latex]
- [latex]I_{Education} = 0.591[/latex]
- [latex]I_{Income} = 0.681[/latex]
- Solution:
- [latex]HDI = (0.800 \times 0.591 \times 0.681)^{1/3}[/latex]
- [latex]HDI = (0.3220)^{1/3} \approx 0.685[/latex]
- This calculated HDI value of 0.685 places the country in the “Medium human development” category.
In-Depth Analysis of HDI Components: Health and Education
The Health Dimension: Life Expectancy as a Synthesis Indicator
- Life Expectancy at Birth is more than just a measure of longevity; it is a powerful synthesis indicator that reflects a wide array of socio-economic factors.
- Determinants of Life Expectancy:
- Healthcare System: Access to and quality of medical care, including primary healthcare, emergency services, specialised treatments, and availability of medical personnel.
- Public Health Infrastructure: Sanitation systems, access to clean drinking water, and waste management, which are critical in preventing the spread of infectious diseases. A state like Kerala, with its historically strong public health initiatives, consistently reports higher life expectancy than the national average.
- Nutrition: The prevalence of malnutrition (both undernutrition and obesity) has a direct impact on mortality rates and overall health. Government programs like the Mid-Day Meal Scheme and the National Food Security Act aim to address this.
- Social Determinants: Factors like female literacy, social safety nets, and levels of violence in a society also have a significant correlation with life expectancy.
- Trends and Disparities:
- Global progress in life expectancy has been one of the major success stories of the past century, rising from a global average of under 50 years in 1950 to over 72 years today.
- However, vast disparities remain. Life expectancy in Very High HDI countries (average of 80.7 years) is significantly greater than in Low HDI countries (average of 61.9 years).
- Events like the HIV/AIDS epidemic in Southern Africa in the 1990s and the recent COVID-19 pandemic have caused temporary but sharp declines in life expectancy in many regions, demonstrating its sensitivity to health crises.
- Determinants of Life Expectancy:
The Education Dimension: A Two-Pronged Approach
- The use of both Mean Years of Schooling (MYS) and Expected Years of Schooling (EYS) provides a dynamic view of a nation’s educational landscape.
Deconstructing Expected Years of Schooling (EYS)
- EYS is a measure of future educational attainment based on current enrolment patterns.
- Significance:
- It reflects the current generation’s access to and participation in education, from primary to tertiary levels.
- It serves as an indicator of a government’s present commitment to education and the perceived value of education within the society.
- High EYS values, such as those above 16 years in Scandinavian countries, often correlate with high public expenditure on education, low dropout rates, and a robust higher education system.
- Limitations and Interpretation:
- EYS is a projection, not a guarantee. It assumes that current enrolment rates will persist, which may not be the case due to economic shocks, policy changes, or shifts in social norms.
- It does not measure the quality of education. A child may be expected to attend school for 14 years, but the quality of teaching, curriculum relevance, and learning outcomes can vary dramatically. This is a significant issue in many developing countries, including parts of India, where high enrolment is not always matched by high learning levels.
- Significance:
Deconstructing Mean Years of Schooling (MYS)
- MYS measures the accumulated educational stock of the adult population (aged 25+).
- Significance:
- It provides a historical perspective on educational access and attainment. A low MYS reflects past deficiencies in the education system.
- The skills, knowledge, and productivity of the current workforce are more closely related to MYS than to EYS. A country with an MYS of 12 years (equivalent to completing secondary education) is likely to have a more skilled labour force than one with an MYS of 5 years.
- The MYS of a country often shows significant gender and regional disparities. For instance, in many patriarchal societies, the MYS for men is substantially higher than for women, reflecting historical discrimination in access to education.
- Numerical Problem: Analysing the MYS-EYS Gap
- Consider two countries:
- Country A: EYS = 15 years, MYS = 14 years. Gap = 1 year.
- Country B: EYS = 12 years, MYS = 6 years. Gap = 6 years.
- Analysis:
- Country A demonstrates a mature and stable education system. Past generations (reflected in MYS) received a high level of education, and the current generation (reflected in EYS) is expected to continue this trend.
- Country B shows a system in transition. The large gap between EYS and MYS indicates that while historical access to education was poor, there have been significant recent improvements and a strong push towards universal schooling for the younger generation. This pattern is common in many developing nations that have recently expanded educational access. India’s EYS of around 13 years compared to its MYS of around 6.9 years reflects this transitional dynamic.
- Consider two countries:
- Significance:
In-Depth Analysis of HDI Component: Standard of Living
The Role of Gross National Income (GNI)
- The choice of GNI per capita as the indicator for the standard of living dimension is deliberate and significant.
- Why GNI over GDP?
- Gross Domestic Product (GDP) measures the total value of goods and services produced within a country’s borders.
- Gross National Income (GNI) measures the total income received by the country from its residents and businesses, regardless of whether they are located in the country or abroad. [latex]GNI = GDP + Net;income;from;abroad[/latex].
- GNI is considered a better measure of a country’s economic welfare because it reflects the actual income that citizens have at their disposal. For countries with significant remittances from citizens working abroad (like the Philippines or Nepal) or large multinational corporations repatriating profits, the difference between GDP and GNI can be substantial. For example, Ireland’s GDP is significantly higher than its GNI due to the profits of multinational tech and pharmaceutical companies based there.
- The Importance of Purchasing Power Parity (PPP)
- Using nominal exchange rates to compare income across countries can be highly misleading because they do not account for differences in price levels.
- PPP acts as a cost-of-living adjustment. It calculates the number of units of a country’s currency required to buy the same amount of goods and services in the domestic market as one U.S. dollar would buy in the United States.
- Example: If a basket of goods costs ₹2500 in India and $\text{100 in the US, the PPP exchange rate would be ₹25 per dollar, even if the market exchange rate is ₹83 per dollar. This shows that the purchasing power of the rupee is higher than the market exchange rate suggests.
- By converting GNI per capita to PPP }$, the HDI provides a much fairer comparison of the material standard of living that citizens can actually achieve with their income.
- Why GNI over GDP?
The Logarithmic Transformation and its Implications
- The use of the natural logarithm ([latex]ln[/latex]) for the income component is a cornerstone of the HDI’s philosophy.
- Principle of Diminishing Returns:
- This transformation is based on the well-established economic principle that the utility or well-being derived from an additional unit of income decreases as income rises.
- An extra $1,000 in income for a person earning $2,000 per year can mean the difference between malnutrition and adequate food, or being ableto afford basic healthcare. The same $1,000 for a person earning $70,000 per year has a much smaller impact on their fundamental well-being.
- Mathematical Impact:
- The log function compresses the scale at the higher end. Let’s examine the impact on the Income Index ([latex]I_{Income}[/latex]).
- An increase in GNIpc from $5,000 to $10,000 (a 100% increase) results in a significant jump in the [latex]I_{Income}[/latex].
- An increase from $40,000 to $45,000 (a 12.5% increase) results in a much smaller increment in the [latex]I_{Income}[/latex].
- The log function compresses the scale at the higher end. Let’s examine the impact on the Income Index ([latex]I_{Income}[/latex]).
- The Cap at $75,000:
- The UNDP sets a maximum goalpost for GNI per capita at $75,000. Any income above this level does not contribute to a higher HDI score.
- The rationale is that beyond a certain point, very high levels of income are not seen as essential for achieving the basic capabilities that the HDI aims to capture. This prevents the index from becoming a measure of sheer economic wealth and reinforces the idea that income is only a means to an end. Countries like Qatar, Singapore, and Liechtenstein have GNI per capita values that exceed this cap.
- Numerical Problem: Illustrating the Diminishing Returns
- Let’s calculate the Income Index for three countries using the formula [latex]I_{Income} = \frac{(ln(GNIpc) – ln(100))}{(ln(75000) – ln(100))}[/latex].
- Country A (Low Income): GNIpc = $2,000.
- [latex]ln(2000) \approx 7.601[/latex].
- [latex]I_{Income} = \frac{(7.601 – 4.605)}{6.620} = \frac{2.996}{6.620} \approx 0.453[/latex]
- Country B (Middle Income): GNIpc = $15,000.
- [latex]ln(15000) \approx 9.616[/latex].
- [latex]I_{Income} = \frac{(9.616 – 4.605)}{6.620} = \frac{5.011}{6.620} \approx 0.757[/latex]
- Country C (High Income): GNIpc = $60,000.
- [latex]ln(60000) \approx 11.002[/latex].
- [latex]I_{Income} = \frac{(11.002 – 4.605)}{6.620} = \frac{6.397}{6.620} \approx 0.966[/latex]
- Country A (Low Income): GNIpc = $2,000.
- Analysis: Notice how the index gain diminishes. A $13,000 income increase from A to B yields an index gain of 0.304. A much larger $45,000 income increase from B to C yields a smaller index gain of 0.209. This mathematically enforces the core principle of the HDI.
- Let’s calculate the Income Index for three countries using the formula [latex]I_{Income} = \frac{(ln(GNIpc) – ln(100))}{(ln(75000) – ln(100))}[/latex].
- Principle of Diminishing Returns:
HDI Classification and Global Rankings
The Four Tiers of Human Development
- The UNDP categorises countries into four groups based on their calculated HDI value. This classification helps in understanding the broad landscape of global development and in identifying groups of countries facing similar challenges. The thresholds are:
- Very High Human Development: HDI value of 0.800 and above.
- High Human Development: HDI value from 0.700 to 0.799.
- Medium Human Development: HDI value from 0.550 to 0.699.
- Low Human Development: HDI value below 0.550.
Analysis of the Top Performers (Very High HDI)
- Countries in the Very High HDI category are typically developed, high-income nations.
- Leading Countries (based on 2023/2024 report):
- Switzerland (HDI: 0.967)
- Norway (HDI: 0.966)
- Iceland (HDI: 0.959)
- Hong Kong, China (SAR) (HDI: 0.956)
- Denmark (HDI: 0.952)
- Common Characteristics:
- Robust social safety nets and extensive public services funded by high levels of taxation.
- High-quality, universally accessible healthcare and education systems. Life expectancy often exceeds 82 years, and expected years of schooling can be over 18 years.
- Stable democratic institutions, strong rule of law, and low levels of corruption.
- Highly diversified, knowledge-based economies with very high GNI per capita, often exceeding $60,000 (PPP $).
- High levels of gender equality and social mobility.
- Leading Countries (based on 2023/2024 report):
Analysis of the Middle Tiers (High and Medium HDI)
- This large group comprises a diverse mix of emerging economies and developing nations.
- High Human Development (0.700-0.799):
- This category includes countries like China (0.788), Brazil (0.760), and Sri Lanka (0.776).
- These nations have generally made significant strides in improving basic health and education and have seen substantial economic growth over the past few decades.
- Challenges often include rising inequality, regional disparities, and environmental degradation. The quality of public services can be inconsistent.
- Medium Human Development (0.550-0.699):
- India (0.685), Bangladesh (0.685), and Pakistan (0.544 falling just shy of the category but indicative) are prominent examples in this tier.
- These countries are in a phase of structural transformation. They have overcome the most severe forms of deprivation but still face significant challenges.
- Key issues include improving the quality of education and healthcare, creating sufficient formal employment, managing rapid urbanisation, and addressing significant gender disparities. India’s recent improvement to a score of 0.685 brings it very close to the ‘High’ development category threshold of 0.700.
- High Human Development (0.700-0.799):
Analysis of the Lowest Performers (Low HDI)
- Countries in the Low HDI category are predominantly located in Sub-Saharan Africa and are often affected by conflict, political instability, and severe environmental challenges.
- Countries with the Lowest HDI (based on 2023/2024 report):
- South Sudan (0.381)
- Somalia (0.404)
- Central African Republic (0.414)
- Niger (0.419)
- Common Characteristics:
- Extremely low GNI per capita, often below $2,000 (PPP $\text{).
- Low life expectancy, sometimes below 55 years, due to high infant mortality, infectious diseases (like malaria), and lack of basic healthcare.
- Very low educational attainment, with mean years of schooling often less than 3 years and EYS below 8 years.
- These countries are often caught in a “development trap” where political instability, conflict, and poverty reinforce each other, making sustained progress extremely difficult.
- Countries with the Lowest HDI (based on 2023/2024 report):
Global Trends and Recent Shocks
- The 2023/2024 Human Development Report highlighted some concerning trends.
- Uneven Recovery: After a global decline in HDI values for the first time ever in 2020 and 2021 due to the COVID-19 pandemic, the recovery has been partial and unequal. Rich countries are experiencing a robust recovery, while many of the poorest countries are not.
- Widening Gap: The gap in HDI between the Very High and Low HDI countries, which had been narrowing for decades, has started to widen again since 2020. This reversal of convergence is a major concern for global equity.
Human Development in India: A National Perspective
India’s Current HDI Status and Trajectory
- According to the 2023/2024 Human Development Report, India holds a rank of 130 out of 193 countries, with an HDI value of 0.685.
- This places India firmly in the “Medium human development” category.
- This represents a notable improvement from its rank of 133 in the previous year’s report, indicating positive momentum.
- The current value of 0.685 is tantalisingly close to the 0.700 threshold required to enter the “High human development” category, a significant milestone the country is poised to achieve in the near future if current trends continue.
A Long-Term View: Progress Since 1990
- The story of India’s human development since the first HDI report in 1990 is one of significant, albeit uneven, progress.
- In 1990, India’s HDI value was a mere 0.446. The increase to 0.685 by 2023 represents a remarkable growth of over 53\% in just over three decades.
- This progress has been faster than the average for countries in the Medium HDI group and also faster than the global average.
- This long-term improvement reflects the combined impact of economic liberalisation post-1991, which spurred growth, and a series of targeted social welfare programmes implemented by successive governments.
Component-Wise Analysis of India’s Progress (1990-2023)
- A deeper look into the components of the HDI reveals where the gains have been most pronounced.
- Health (Life Expectancy at Birth):
- In 1990, life expectancy at birth was approximately 58.6 years.
- By 2023, it had risen to 72.0 years, an increase of over 13 years.
- This improvement is a testament to the success of national health initiatives like the National Rural Health Mission (NRHM), improved sanitation, widespread immunisation campaigns, and better management of diseases. Life expectancy is now the highest it has been since the index began.
- Education (Schooling):
- Expected Years of Schooling (EYS) increased from 8.25 years in 1990 to 13.0 years in 2023. This reflects the success of policies like the Sarva Shiksha Abhiyan in boosting school enrolment.
- Mean Years of Schooling (MYS) for adults aged 25+ grew from 2.8 years in 1990 to 6.9 years in 2023. While this is a substantial increase, it also highlights the legacy of educational deprivation among older generations and remains a key area for improvement. The gap between EYS (13.0) and MYS (6.9) underscores the ongoing educational transition.
- Standard of Living (GNI per capita):
- GNI per capita (in 2021 PPP }$) saw the most dramatic increase, rising from approximately $2,167 in 1990 to $9,047 in 2023. This represents a more than four-fold increase.
- This rapid economic growth has been a major driver of the overall HDI improvement, providing the resources for both public investment and private consumption.
- Health (Life Expectancy at Birth):
The Challenge of Inequality
- While the overall HDI tells a positive story, it masks the significant issue of inequality.
- When India’s HDI value of 0.685 is adjusted for inequality (using the IHDI methodology), it falls by 30.7%.
- This “loss” due to inequality is one of the highest in the region and is significantly larger than the loss in countries like China.
- The inequality is stark across all three dimensions: income, education, and health, and is particularly pronounced along lines of gender, caste, and region. Addressing this inequality is the most critical challenge for elevating the country’s human development status in a truly inclusive manner.
Sub-national Human Development in India: A State-Level Analysis
The Stark Landscape of Regional Disparity
- India’s national HDI average conceals a vast and complex tapestry of sub-national variations. The developmental gap between the highest and lowest-performing states is comparable to the difference between developed and least-developed countries.
- This heterogeneity means that policy solutions must be highly contextualised, as a one-size-fits-all approach is unlikely to be effective.
The High Achievers: Southern and Western States
- A cluster of states, primarily in the southern and western parts of the country, consistently outperforms the national average.
- Top Performing States (based on recent data, e.g., 2022 figures):
- Goa (HDI: ~0.760)
- Kerala (HDI: ~0.758)
- Delhi (as a city-state) (HDI: ~0.734)
- Sikkim, Chandigarh, and Himachal Pradesh also feature in the top tier.
- Analysis of Success Factors in a state like Kerala:
- Historical Legacy: Early emphasis on education and health by princely states and missionary activities created a strong foundation.
- High Social Sector Spending: Consistent government investment in public education and healthcare infrastructure.
- High Literacy: Particularly female literacy, which has a strong positive correlation with better health outcomes and lower fertility rates.
- Social Reforms: A history of social reform movements that challenged caste-based discrimination and promoted greater equity.
- Global Linkages: High levels of international migration and remittances have also boosted household incomes.
- These states have HDI values that place them in the ‘High’ human development category, comparable to countries in Eastern Europe or Latin America.
- Top Performing States (based on recent data, e.g., 2022 figures):
The Lagging Regions: The ‘BIMARU’ States and Others
- A group of states in the northern, central, and eastern belts of India face more profound developmental challenges.
- Lowest Performing States (based on recent data):
- Bihar (HDI: ~0.577)
- Uttar Pradesh (HDI: ~0.609)
- Madhya Pradesh (HDI: ~0.619)
- Jharkhand and Assam also fall into this category.
- The acronym ‘BIMARU’ (Bihar, Madhya Pradesh, Rajasthan, Uttar Pradesh) was coined in the 1980s to describe the poor demographic and development indicators in these states, and the challenges persist.
- Analysis of Challenges in a state like Bihar:
- Structural Issues: A predominantly agrarian economy with low levels of industrialisation and urbanisation.
- Governance and Institutional Weakness: Historical challenges in public service delivery and institutional capacity.
- Poor Health and Education Infrastructure: Lower-than-average availability and quality of schools and health facilities. Bihar’s life expectancy and literacy rates are among the lowest in the country.
- High Population Density and Growth: Puts immense pressure on limited resources and infrastructure.
- The HDI values of these states place them at the lower end of the ‘Medium’ development category, with human development outcomes comparable to some Sub-Saharan African nations.
- Lowest Performing States (based on recent data):
Numerical Problem: Quantifying the Inter-State Gap
- Let’s compare the component indicators for a high-performing state (hypothetical data based on Kerala’s profile) and a low-performing state (hypothetical data based on Bihar’s profile) to illustrate the gap.
- State A (High-Performer):
- Life Expectancy: 75.5 years
- Mean Years of Schooling: 9.5 years
- GNI per capita (sub-national estimate, PPP): $12,000
- State B (Low-Performer):
- Life Expectancy: 69.5 years
- Mean Years of Schooling: 6.0 years
- GNI per capita (sub-national estimate, PPP): $4,500
- State A (High-Performer):
- Calculating the Dimension Indices (using national HDI goalposts for comparison):
- Health Index:
- State A: [latex]\frac{(75.5 – 20)}{(85 – 20)} \approx 0.854[/latex]
- State B: [latex]\frac{(69.5 – 20)}{(85 – 20)} \approx 0.762[/latex]
- Education Index (simplifying to just MYS for this example):
- State A: [latex]\frac{(9.5 – 0)}{(15 – 0)} \approx 0.633[/latex]
- State B: [latex]\frac{(6.0 – 0)}{(15 – 0)} = 0.400[/latex]
- Income Index:
- State A: [latex]\frac{(ln(12000) – ln(100))}{(ln(75000) – ln(100))} \approx 0.725[/latex]
- State B: [latex]\frac{(ln(4500) – ln(100))}{(ln(75000) – ln(100))} \approx 0.575[/latex]
- Health Index:
- Analysis: The gap is significant across all three dimensions. The difference is particularly stark in the Education and Income indices, highlighting that the disparity is not just about health but is deeply rooted in economic opportunity and educational attainment. This is why a decentralised, state-specific policy focus is critical for India’s overall human development.
Beyond the HDI: Inequality and Gender Dimensions
The Inequality-Adjusted Human Development Index (IHDI)
- The standard HDI is an index of average achievement and, as such, can mask significant inequalities in the distribution of human development within a country.
- To address this, the UNDP introduced the Inequality-adjusted HDI (IHDI) in 2010.
- Concept: The IHDI can be viewed as the actual level of human development, while the HDI is the potential level of human development (that could be achieved if there were no inequality).
- Calculation: The IHDI adjusts each of the three dimension indices (health, education, income) for inequality within that dimension, and then aggregates these inequality-adjusted indices. The inequality measure used is a variant of the Atkinson index.
- The “Loss” in HDI: The difference between the HDI and the IHDI is expressed as a percentage and represents the “loss” in human development due to inequality.
- [latex]Loss;(%) = \frac{(HDI – IHDI)}{HDI} \times 100[/latex]
- Interpretation:
- If a country has perfect equality, its HDI and IHDI values will be the same (loss = 0%).
- The greater the inequality, the lower the IHDI value will be relative to the HDI, and the higher the percentage loss.
- Countries like Norway and Finland have relatively low losses due to inequality (around 5-7%), reflecting their egalitarian social models.
- In contrast, countries with high income and social stratification, like many in Latin America and South Asia, can have losses exceeding 25-30%.
- India’s IHDI:
- As mentioned earlier, India’s loss in HDI due to inequality is a substantial 30.7%.
- Its HDI of 0.685 drops to an IHDI of 0.475 when adjusted for inequality. This means the country’s actual realised human development is equivalent to a much lower level than its potential suggests, underscoring that the benefits of growth and development have not been shared equally.
The Gender Development Index (GDI)
- The GDI was introduced in 1995 and later reformulated in 2014 to directly measure the gender gap in human development achievements.
- Concept: The GDI is not a standalone measure of women’s empowerment. Instead, it measures gender disparities in the same three dimensions as the HDI: health, education, and command over economic resources.
- Calculation:
- An HDI is calculated separately for females ([latex]HDI_f[/latex]) and for males ([latex]HDI_m[/latex]) using gender-disaggregated data.
- The GDI is then calculated as the ratio of the female HDI to the male HDI.
- [latex]GDI = \frac{HDI_f}{HDI_m}[/latex]
- Interpretation:
- A GDI value of 1.000 indicates perfect gender parity, meaning females and males have the same HDI value.
- The further the GDI value is from 1.000, the greater the gender gap in favour of males.
- The UNDP classifies countries into five groups based on the GDI value to allow for easier comparison.
- India’s GDI:
- For 2022, India’s female HDI value was 0.582, while the male HDI value was 0.684.
- This results in a GDI value of [latex]\frac{0.582}{0.684} \approx 0.852[/latex].
- This value places India in Group 5, indicating a large gender gap in human development. The disparity is particularly large in the economic dimension, with a significant difference in estimated GNI per capita between men and women. The female labour force participation rate in India, at around 41.7%, is also significantly lower than for males, contributing to this gap.
The Gender Inequality Index (GII)
- While the GDI measures gender gaps in basic capabilities, the Gender Inequality Index (GII) was introduced to capture the loss in human development due to inequality between female and male achievements in three key areas.
- Dimensions of GII:
- Reproductive Health: Measured by the maternal mortality ratio and the adolescent birth rate.
- Empowerment: Measured by the proportion of parliamentary seats occupied by females and the proportion of adult females and males with at least some secondary education.
- Economic Status (Labour Market): Measured by the labour force participation rate of female and male populations aged 15 years and older.
- Interpretation: The GII is an inequality index. Higher GII values indicate greater disparities between women and men and thus a greater loss to human development. A value of 0 indicates perfect gender equality.
- India’s GII value of 0.437 and rank of 108 out of 166 countries in the 2022 index signals significant disadvantages for women in these key areas.
- Dimensions of GII:
A Critical Appraisal and Limitations of the HDI
Strengths and Contributions of the HDI
- Despite its limitations, the success and impact of the HDI are undeniable.
- Shifting Policy Focus: The HDI has been instrumental in shifting the development discourse away from a singular obsession with GDP growth towards a more balanced approach that prioritises human well-being.
- Public Advocacy Tool: Its simplicity and transparency make it a powerful tool for policymakers, activists, and the public to hold governments accountable for their performance in key social sectors.
- Spurring Competition: The annual publication of HDI rankings creates a “name and shame” effect, encouraging countries to invest more in health and education to improve their standing.
- Catalyst for Better Data: The demand for HDI data has pushed many countries to improve their statistical capacity and collect more reliable data on social indicators.
Inherent Limitations and Criticisms
- The HDI has faced numerous academic and methodological criticisms since its inception.
- Oversimplification: By reducing the complex reality of human development to a single number based on just three dimensions, the HDI inevitably misses a lot. It is a measure of average achievement and does not capture the richness of human life.
- Lack of Key Dimensions: The index has been criticised for omitting several crucial aspects of human well-being:
- Political Freedoms and Human Rights: The HDI does not account for the state of democracy, freedom of speech, or the rule of law. A country could have a high HDI while being an autocracy with severe human rights violations.
- Environmental Sustainability: A country can achieve a high HDI through environmentally destructive practices (e.g., deforestation, high carbon emissions), which undermines the well-being of future generations. There have been proposals for a “Sustainable HDI” that adjusts the index for environmental impact.
- Social and Cultural Factors: The index does not measure social cohesion, community life, or cultural identity, which are important aspects of a fulfilling life.
- Happiness and Subjective Well-being: The HDI focuses on objective indicators and does not incorporate measures of life satisfaction or happiness.
- Issues with Data Quality and Comparability:
- The accuracy and reliability of the underlying data (especially GNI per capita and schooling data) can be questionable in some developing countries with weak statistical systems.
- Frequent revisions to the methodology and goalposts make it difficult to compare HDI values and rankings accurately over long periods.
The Problem of Weighting and Aggregation
- The choice of weights for the three dimensions is a significant point of contention.
- The HDI gives equal weight ([latex]\text{1/3}[/latex]) to the logarithm of income, health, and education. This equal weighting is a normative judgment and is not based on any empirical evidence about what people value most.
- Different individuals and societies might place different weights on these dimensions. The uniform weighting scheme imposes a “one-size-fits-all” structure on the concept of development.
- The use of the geometric mean since 2010 addressed the issue of perfect substitutability inherent in the old arithmetic mean, but the fundamental issue of equal weights remains. An alternative approach could involve using statistical methods like Principal Component Analysis (PCA) to derive the weights empirically, though this would sacrifice the simplicity of the index.
Comparative Analysis Through Data Visualisation
Chart 1: India’s HDI Trend vs. BRICS Nations (2000-2023)

- Description of the Chart:
- Type: Line Chart.
- X-Axis: Year (from 2000 to 2023).
- Y-Axis: HDI Value (from 0.500 to 0.900).
- Series: Five distinct coloured lines, one for each BRICS country (Brazil, Russia, India, China, South Africa).
- Data Insights and Analysis:
- Convergence and Divergence: The chart would show that in the early 2000s, the BRICS nations were clustered more closely, with India and China at the lower end. Over time, all lines would show an upward trend, indicating progress across the bloc.
- China’s Rapid Ascent: The line for China would exhibit the steepest slope, showcasing its exceptionally rapid increase in HDI, driven by massive economic growth and targeted investments in health and education. It would be seen overtaking Brazil and South Africa to approach Russia’s level.
- India’s Steady Growth: India’s line would show a consistent, steady upward trajectory, reflecting solid but less explosive growth compared to China. It would start at the bottom of the pack and remain there, but the gap with others like South Africa and Brazil would be visible. Its recent HDI of 0.685 would show it on par with or slightly ahead of South Africa for some periods.
- Russia’s High Plateau: Russia’s line would start at a much higher level (already in the ‘High’ category) due to its legacy of high educational attainment and would show slower, more incremental growth, eventually reaching the ‘Very High’ category.
- Brazil and South Africa’s Trajectory: These two nations would likely show periods of growth interspersed with stagnation, reflecting economic volatility and persistent social challenges, particularly inequality in South Africa’s case.
- Overall Takeaway: The chart would visually narrate the shifting dynamics within the BRICS, highlighting China’s remarkable catch-up story and India’s steady but ongoing journey towards higher human development.
Chart 2: Sub-National HDI Disparities in India – A Bar Chart Comparison

- Description of the Chart:
- Type: Horizontal Bar Chart.
- Y-Axis: List of major Indian States (e.g., Kerala, Goa, Tamil Nadu, Punjab, Maharashtra, Gujarat, Uttar Pradesh, Madhya Pradesh, Bihar).
- X-Axis: HDI Value (from 0.500 to 0.800).
- Additional Element: A vertical dashed line indicating the national average HDI (at 0.685).
- Data Insights and Analysis:
- Visualising Inequality: The chart would immediately and powerfully illustrate the vast chasm in human development within India. The length of the bars would vary dramatically.
- The Top Tier: Kerala and Goa would have the longest bars, extending well past the national average line and deep into the ‘High’ development territory (approaching 0.760). States like Tamil Nadu and Maharashtra would also be comfortably above the national average.
- The Bottom Tier: Bihar would have the shortest bar, falling significantly below the national average (around 0.577). Uttar Pradesh and Madhya Pradesh would also have bars that are visibly shorter than the average.
- The Crowded Middle: A large number of states would be clustered around the national average line, some just above, some just below.
- Policy Implication: This visualisation would make a compelling case for targeted, region-specific policy interventions. It would clearly show that national-level policies need to be adapted to address the unique challenges of the lagging states to promote a more balanced and equitable national development.
Chart 3: Component Analysis – India vs. Sri Lanka vs. Pakistan (2023)
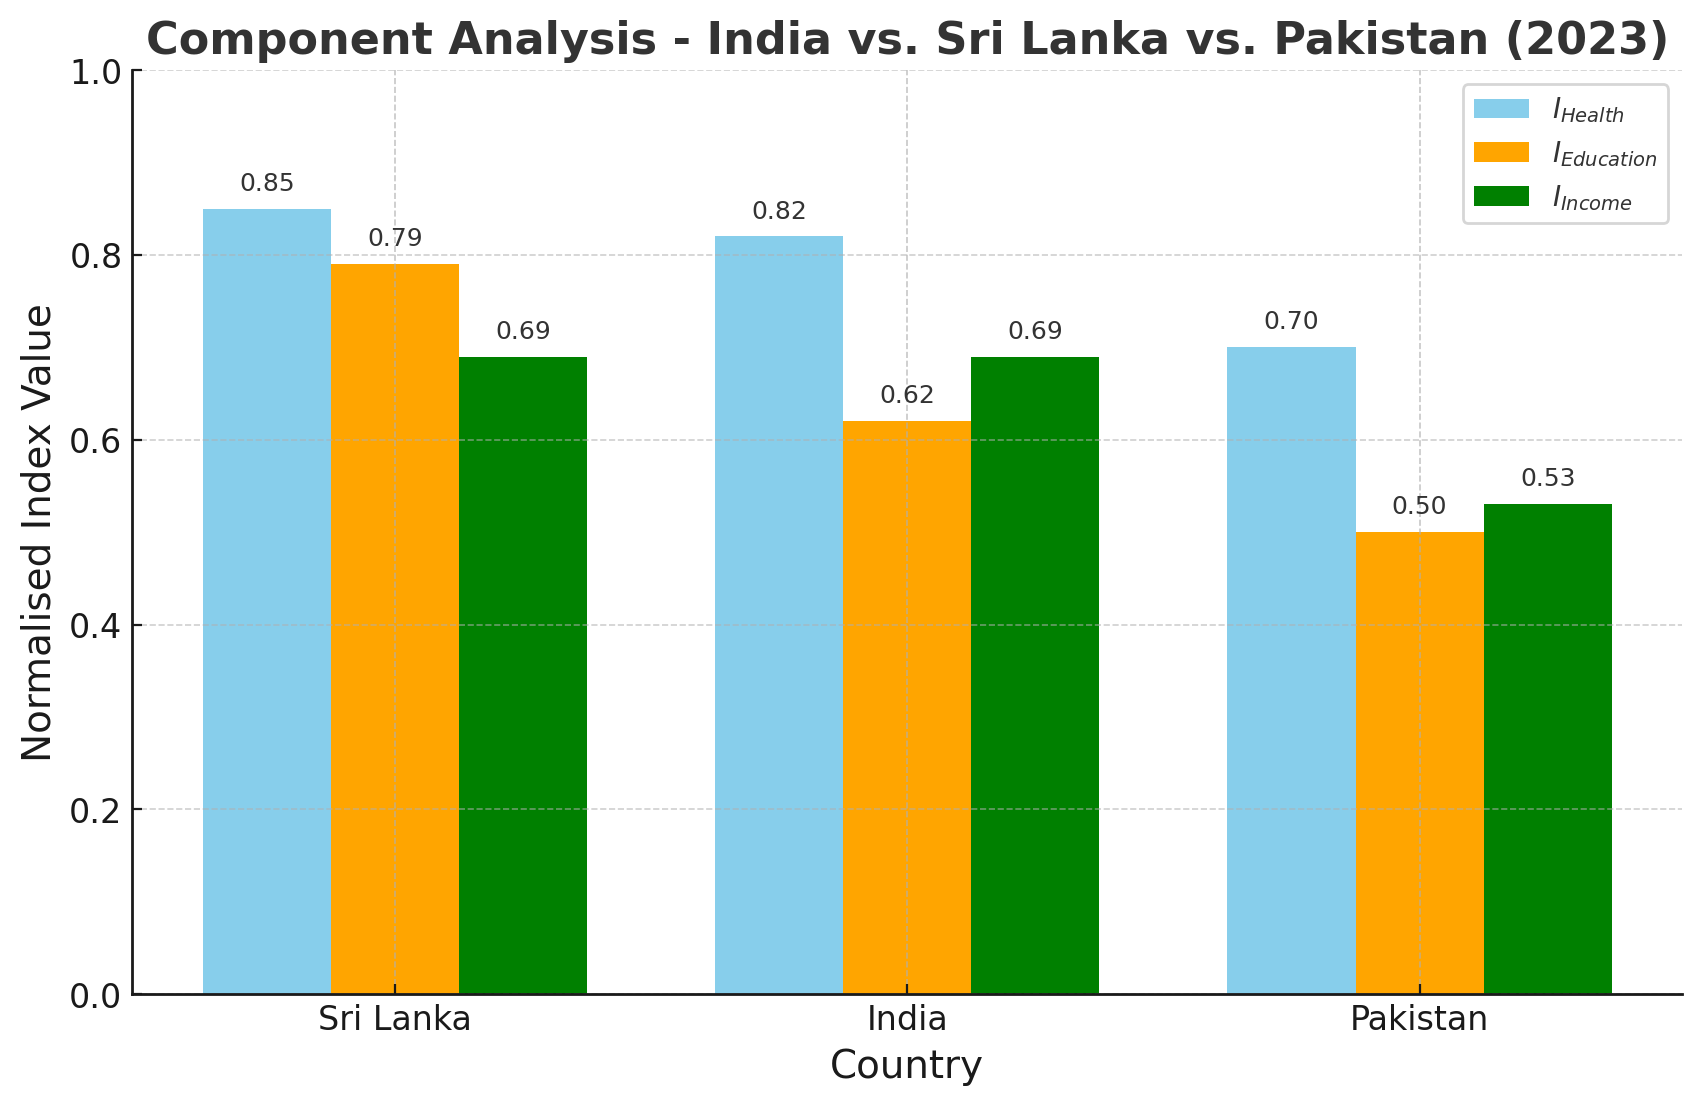
- Description of the Chart:
- Type: Grouped Column Chart.
- X-Axis: Three groups of columns, one for each country (Sri Lanka, India, Pakistan).
- Y-Axis: Normalised Index Value (from 0.0 to 1.0).
- Series: Within each country group, there would be three coloured columns representing the three dimension indices: Health Index ([latex]I_{Health}[/latex]), Education Index ([latex]I_{Education}[/latex]), and Income Index ([latex]I_{Income}[/latex]).
- Data Insights and Analysis:
- Sri Lanka’s Balanced Profile: Sri Lanka (overall HDI ~0.776) would likely show high and relatively balanced columns for Health and Education, reflecting its long history of strong social development policies. Its Income Index might be lower in comparison, indicating that its high human development is not solely a function of wealth.
- India’s Profile: India (overall HDI ~0.685) would show a relatively strong Health Index (reflecting its 72-year life expectancy). Its Income Index would also be reasonably high, reflecting its status as a major emerging economy. The Education Index, however, would likely be the lowest of the three, dragged down by the low Mean Years of Schooling (6.9 years), highlighting education as a key area for improvement.
- Pakistan’s Profile: Pakistan (overall HDI ~0.544) would show lower columns across all three dimensions compared to India and Sri Lanka. The disparity would be particularly noticeable in the Education and Income indices, explaining its position in the ‘Low’ (or very bottom of ‘Medium’) HDI category.
- Comparative Insight: This chart would allow for a nuanced comparison, moving beyond the single HDI number. It would show, for instance, that while India’s income level is higher than Sri Lanka’s, its overall HDI is lower because Sri Lanka performs significantly better on the non-income dimensions of health and especially education. This reinforces the core message of the HDI: that wealth does not automatically translate into better human development outcomes.
Policy Implications of HDI for Developing Economies
A Guiding Framework for National Policy
- The HDI and its family of indices (IHDI, GDI, GII) provide a powerful framework for governments to diagnose challenges and formulate evidence-based policies.
- Budget Allocation: By analysing the components of its HDI, a government can identify which dimension is lagging the most and prioritise budgetary resources accordingly. If the Education Index is low due to poor MYS, it signals a need for adult literacy and skill development programmes. If the Health Index is stagnating, it points to the need for greater investment in public healthcare.
- Setting National and Sub-national Targets: Governments can use the HDI framework to set clear, measurable targets for development. For example, a state government in India could set a target to move from the ‘Medium’ to the ‘High’ HDI category within a decade and design its five-year plans around achieving the necessary improvements in life expectancy, schooling, and income.
- Monitoring and Evaluation: The annual HDI reports serve as an external monitoring mechanism, allowing governments and citizens to track progress over time and evaluate the effectiveness of policies.
Focusing on Pro-Poor and Inclusive Growth
- The HDI framework inherently advocates for a model of development that is inclusive and beneficial to all sections of society.
- Beyond ‘Trickle-Down’: The logarithmic treatment of income and the emphasis on health and education challenge the notion that simply maximising GDP growth is sufficient. It pushes for a focus on the quality and distribution of growth.
- Investing in Human Capital: The index highlights that investing in the health and education of the population is not just a social expenditure but a crucial economic investment. A healthier, better-educated workforce is more productive and innovative, leading to more sustainable long-term economic growth. Policies like universal healthcare, conditional cash transfers for school attendance, and nutritional support programmes (like India’s ICDS) are directly aligned with improving HDI.
- Tackling Inequality with IHDI: The IHDI provides policymakers with a clear metric to focus on inequality. A high “loss” percentage signals the need for policies aimed at redistribution and equity, such as progressive taxation, land reforms, investments in marginalised regions, and affirmative action to support disadvantaged social groups.
Addressing Gender Disparities for Accelerated Development
- The GDI and GII provide actionable insights for gender-responsive policymaking.
- Identifying Specific Gaps: These indices allow governments to move beyond general statements about women’s empowerment to identify specific areas of disadvantage. A low GDI might be driven by poor educational outcomes for girls, while a high GII could be due to low female political representation or high maternal mortality.
- The ‘Double Dividend’ of Gender Equality: Investing in women and girls yields a “double dividend.” It not only improves their own well-being but also has a multiplier effect on the development of their families and communities. Educated mothers have healthier children who are more likely to attend school, breaking the intergenerational cycle of poverty. Increasing female labour force participation can provide a significant boost to a country’s economic growth.
- Policy Interventions: Based on the GII and GDI, governments can design targeted interventions such as scholarships for girls’ education, safe transport to schools, improved access to reproductive healthcare, laws promoting women’s inheritance rights, and quotas for female representation in political bodies.
The Human Development Index, while not without its flaws, has fundamentally reshaped our understanding of what it means for a nation to be developed. It has successfully championed a more holistic, people-centric vision of progress, providing a vital counterbalance to purely economic metrics. For a country like India, with its immense diversity and complex challenges, the HDI and its associated indices serve as an indispensable compass, guiding the policy discourse towards the ultimate goal of ensuring that every citizen has the capability to lead a long, healthy, and fulfilling life.
- Critically examine the HDI’s effectiveness as a comprehensive measure of national welfare. (250 words)
- How do sub-national HDI variations in India reflect underlying structural inequalities? (250 words)
- Discuss the policy value of using inequality-adjusted indices alongside the standard HDI. (250 words)

Responses